The Premise: Pareto’s Law
The late Josheph Juran introduced the world to Pareto’s Law, aptly named after Italian economist Vilfredo Pareto. Many business and quality professionals alike are familiar with Pareto’s law and often refer to it as the 80 / 20 rule. In simple terms, Pareto’s Law is based on the premise that 80% of the effects stem from 20% of the causes.
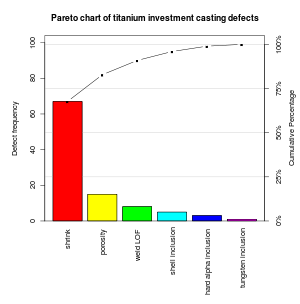
As an example, consider that Pareto’s Law is often used by quality staff to determine the cause(s) responsible for the highest number of defects as depicted in the chart to the right. From this analysis, teams will focus their efforts on the top 1 or 2 causes and resolve to eliminate or substantially reduce their effect.
In this case, the chart suggests that highest number of defects are due to shrink followed by porosity. At this point a problem solving strategy is established using one of the many available tools (8 Discipline Report, 5 Why, A3) to resolve the root cause and eliminate the defect. Over time and continued focus, the result is a robust process that yields 100% quality, defect free, products.
In practice, this approach seems logical and has proven to be effective in many instances. However, we need to be cognizant of a potential side effect that may be one of the reasons why new initiatives quickly wane to become “the program of the day.”
The Side Effects: Burnout and Apathy
Winning the team’s confidence is often one of the greatest challenges for any improvement initiative. A common strategy is to select a project where success can be reasonably assured. If we apply Pareto’s Law to project selection, we are inclined to select a project that is either relatively easy to solve, offers the greatest savings, or both.
In keeping with the example presented in the graphic, resolving the “shrink” concern presents the greatest opportunity. However, we can readily see that, once resolved, the next project presents a significantly lower return and the same is true for each subsequent project thereafter.
Clearly, as each problem is resolved, the return is diminished. To compound matters, problems with lower rates of recurrence are often more difficult to solve and the monies required to resolve them cannot be justified due to the reduced return on investment. In other words, we approach the point where the solution is as elusive as “the needle in a haystack” and, once found, it simply isn’t feasible to fund it.
The desire to resolve the concern is significantly reduced with each subsequent challenge as the return on investment in time and money diminishes while the team continues to expend more energy. Over extended periods of time the continued pursuit of excellence leads to apathy and may even lead to burnout. As alluded to earlier, adding to the frustration is the inability to achieve the same level of success offered by the preceding opportunities.
The Solution
One of the problems with the approach as presented here is the focus on resolving the concern or defect that is associated with the greatest cost savings. To be clear, Pareto Analysis is a very effective tool to identify improvement opportunities and is not restricted to just quality defects. A similar Pareto chart could be created just as easily to analyze process down time.
Perhaps the real problem is that we’re sending the wrong message: Improvements must have an immediate and significant financial return. In other words, team successes are typically recognized and rewarded in terms of absolute cost savings. Not all improvements will have a measurable or immediate return on investment. If a condition can be improved or a problem can be circumvented, employees should be empowered to take the required actions as required regardless of where they fall on the Pareto chart.
To assure sustainability, we need to focus on the improvement opportunities that are before us with a different definition of success, one with less emphasis on cost savings alone. Is it possible to make improvements for improvements sake? We need to take care of the “low hanging fruit” and that likely doesn’t require a Pareto analysis to find it.
Finally, not all improvement strategies require a formal infrastructure to assure improvements occur. In this regard, the ability to solve problems at the employee level is one of the defining characteristics that distinguishes companies like Toyota from others that are trying to be like them. Toyota and the principles of lean are not reliant on tools alone to identify opportunities to improve.
Until Next Time – STAY lean!
 Vergence Analytics
Twitter: @Versalytics

