Background: This is a more general presentation of “Variation: OEE’s Silent Partner” published on January 31, 2011.
In a perfect world we can produce quality parts at rate, on time, every time. In reality, however, all aspects of our processes are subject to variation that affects each factor of Overall Equipment Effectiveness: Availability, Performance, and Quality.
Our ability to effectively implement Preventive Maintenance programs and Quality Management Systems is reflected in our ability to control and improve our processes, eliminate or reduce variation, and increase throughput.
The Variance Factor
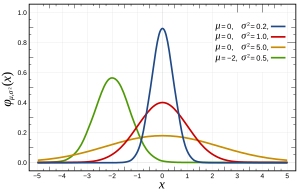
Every process and measurement is subject to variation and error. It is only reasonable to expect metrics such as Overall Equipment Effectiveness and Labour Efficiency will also exhibit variance. The normal distribution for four (4) different data sets are represented by the graphic that accompanies this post. You will note that the average for 3 of the curves (Blue, Red, and Yellow) is common (u = 0) and the shapes of the curves are radically different. The green curve shows a normal distribution that is shifted to the left, the average (u) is -2, although we can see that the standard deviation for this distribution is better than that of the yellow and red curves.
The graphic also allows us to see the relationship between the Standard Deviation and the shape of curve. As the Standard Deviation increases, the height decreases and the width increases. From these simple representations, we can see that our objective is to reduce to the standard deviation. The only way to do this is to reduce or eliminate variation in our processes.
We can use a variety of statistical measurements to help us determine or describe the amount of variation we may expect to see. Although we are not expected to become experts in statistics, most of us should already be familiar with the normal distribution or “bell curve” and terms such as Average, Range, Standard Deviation, Variance, Skewness, and Kurtosis. In the absence of an actual graphic, these terms help us to picture what the distribution of data may look like in our mind’s eye.
Run Time Data
The simplest common denominator and readily available measurement for production is the quantity of good parts produced. Many companies have real-time displays that show quantity produced and in some cases go so far as to display Overall Equipment Effectiveness (OEE) and it’s factors – Availability, Performance, and Quality. While the expense of live streaming data displays can be difficult to justify, there is no reason to abandon the intent that such systems bring to the shop floor. Equivalent means of reporting can be achieved using “whiteboards” or other forms of data collection.
I am concerned with any system that is based solely on cumulative shift or run data that does not include run time history. As such, an often overlooked opportunity for improvement is the lack of stability in productivity or throughput over the course of the run. Systems with run time data allow us to identify production patterns, significant swings in throughput, and to correlate this data with down time history. This production story board allows us to analyze sources of instability, identify root causes, and implement timely and effective corrective actions. For processes where throughput is highly unstable, I recommend a direct hands-on review on the shop floor in lieu of post production data analysis.
Overall Equipment Effectiveness
Overall Equipment Effectiveness and the factors Availability, Performance, and Quality do not adequately or fully describe the capability of the production process. Reporting on the change in standard deviation as well as OEE provides a more meaningful understanding of the process and its inherent capability.
Improved capability also improves our ability to predict process throughput. Your materials / production control team will certainly appreciate any improvements to stabilize process throughput as we strive to be more responsive to customer demand and reduce inventories.
Until Next Time – STAY lean!
 Vergence Analytics
Twitter: @Versalytics


2 thoughts on “OEE in an imperfect world”