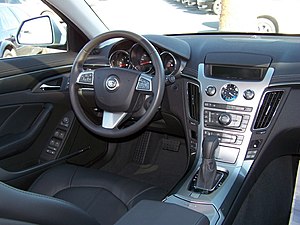
I recently published, Urgent -> The Cost of Things Gone Wrong, where I expressed concern for dashboards that are attempting to do too much. In this regard, they become more of a distraction instead of serving the intended purpose of helping you manage your business or processes. To be fair, there are at least two (2) levels of data management that are perhaps best differentiated by where and how they are used: Scorecards and Dashboards.
I prefer to think of Dashboards as working with Dynamic Data. Data that changes in real-time and influences our behaviors similar to the way the dashboard in our cars work to communicate with us as we are driving. The fuel gauge, odometer, two trip meters, tachometer, speedometer, digital fuel consumption (L/100 km), and km remaining are just a few examples of the instrumentation available to me in my Mazda 3.
While I appreciate the extra instrumentation, the two that matter first and foremost are the speedometer and the tachometer (since I have a 5 speed manual transmission). The other bells and whistles do serve a purpose but they don’t necessarily cause me to change my driving behavior. Of note here is that all of the gauges are dynamic – reporting data in real time – while I’m driving.
A Scorecard on the other hand is a periodic view of summary data and from our example may include Average Fuel Consumption, Average Speed, Maximum Speed, Average Trip, Maximum Trip, Total Miles Traveled and so on. The scorecard may also include other items such as driving record / vehicle performance data such as Parking Tickets, Speeding Tickets, Oil Changes, Flat Tires, Emergency and Preventive Maintenance.
One of my twitter connections, Bob Champagne (@BobChampagne), published an article titled, Dashboards Versus Scorecards- Its all about the decisions it facilitates…, that provides some great insights into Scorecards and Dashboards. This article doesn’t require any further embellishment on my part so I encourage you to click here or paste the following link into your browser: http://wp.me/p1j0mz-6o. I trust you will find the article both informative and engaging.
Next Steps:
Take some time to review your current metrics. What metrics are truly influencing your behaviors and actions? How are you using your metrics to manage your business? Are you reacting to trends or setting them?
It’s been said that, “What gets measured gets managed.” I would add – “to a point.” It simply isn’t practical or even feasible to measure everything. I say, “Measure to manage what matters most”.
Remember to get your free Excel Templates for OEE by visiting our downloads page or the orange widget in the sidebar. You can follow us on twitter as well @Versalytics.
Until Next Time – STAY lean!


